FREDERIX CloudWiFi Analytics
All data and activities at a glance
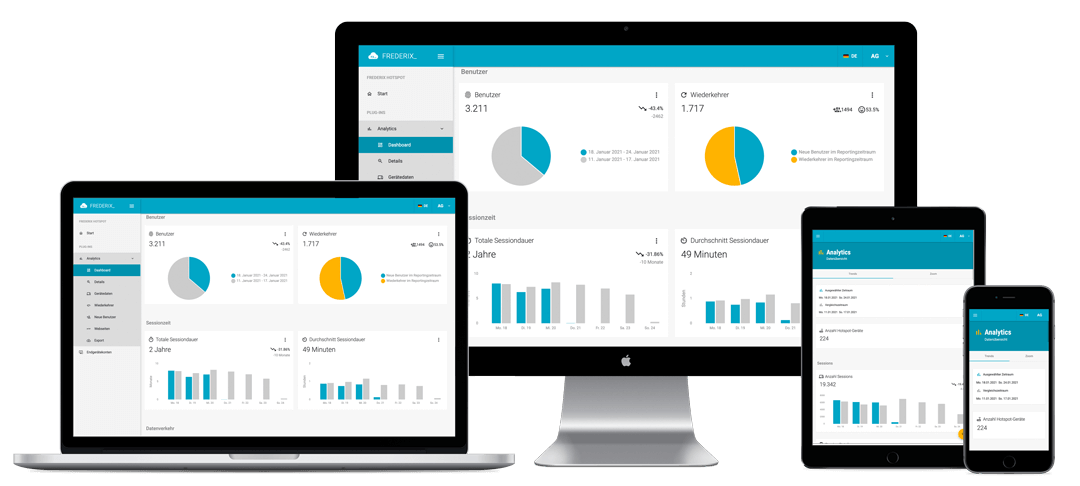
The FREDERIX hotspot dashboard shows all relevant data on the use and status of hotspots and makes them available on an intuitive user interface. This gives you a complete overview and your own individual analysis at all times. By selecting freely-definable periods, you can optimally compare changes.
If you use the FREDERIX hotspot at several locations (e.g., in branches), you will not only receive analyses for each location, but also a global analysis of summarised data. Thus, key figures can also be analysed separately and individual locations can be perfectly compared with one another.

Usable everywhere – Flexible and platform-independent
No software, no installation and always up to date: the web-based dashboard can be accessed from anywhere and from all internet-enabled end devices. All you need is an up-to-date browser on your mobile phone, tablet or PC.
The dashboard
Your quick overview of the most important figures and changes in your system. With the zoom function you can view all charts of the selected period in a larger and finer scale.
You can quickly and easily compare the current data with a desired period and display them together. This makes it possible to evaluate your campaigns and changes in a targeted manner.

Analyses in the dashboard
Hotspots
- Number of hotspot devices
Users
- User count
- Number of recurring users
Sessions
- ⌀ Sessions per user
- ⌀ Session duration per user
- ⌀ Sessions per day
- ⌀ Sessions per hotspot
- Total session duration
- Average session duration
Traffic
- ⌀ Traffic per user
- ⌀ Download per user
- ⌀ Upload per user
- ⌀ Traffic per session
- Total data volume
- Download per session
- Upload volume total
- Upload per session

Details
This view shows you more information about the sessions and traffic. You can freely determine the evaluation period and the devices to be evaluated. You can very quickly evaluate predefined groups or individual units based on the unit groups you have created. This makes it easy to create and evaluate individual locations or cross-location statistics.
Evaluations in the Details area
General
- User count
- Number of hotspot devices
Sessions
- Number of sessions
- Total session duration
- ⌀ Session duration
- ⌀ Sessions per day
- ⌀ Sessions per hotspot
- ⌀ Traffic per session
- ⌀ Download per session
- ⌀ Upload pro Session
User details
- ⌀Sessions per user
- ⌀ Traffic per user
- ⌀ Download per user
- ⌀ Upload per user
- ⌀ Session duration per user
- ⌀ User per Hotspot
- ⌀ Sessions per user
- ⌀ Traffic per user
- ⌀ Download per user
- ⌀ Upload per user
- ⌀ Session duration per user
- ⌀ User per Hotspot
Traffic
- Total traffic
- Total upload traffic
- Total download traffic
- Upload per session
- Download per session
Device Data
See which devices your WiFi users are using to go online and find out which language they have set on your system. This can help you to adapt your content even better to your target groups and, for example, offer content in additional languages.

Evaluations in the area of device data
Device software information
- Operating system
- Operating system Version
- Browser
Device hardware informationen
- Manufacturer
- Device model name
- Device type
Device settings
- Set language of the device

Recurring users
With the ratio of new to returning users, you can measure the success of your campaigns and advertising. The figures are also suitable as a benchmark for comparing different campaigns.
Evaluations in the area of recurring users
Device software information
- Number of users per defined time period
- Number of recurring users per defined time period
New users
A new user is a user who has never been in this WiFi before. The number of new users allows conclusions to be drawn about the acquisition of new customers. Furthermore, it is an indicator of the general acceptance of the customer WiFi in your clientele.

Evaluations in the area of recurring users
Device software information
- Number of users per defined time period
- Number of recurring users per defined time period

Webseites
The website analytics display the visited websites and provide further information for classification and categorisation. In combination with the FREDERIX parental control filter, you can get statistics of the blocked content. In addition, the website analytics graphically displays the load over the day. This allows you to see when your users surf most often.
Export
The export functions help you to transfer the acquired data into your own systems or Big Data and to evaluate it externally. With a simple wizard you can configure your data export according to your wishes.


